The cost of battery energy storage in the US fell by 72% between 2015 and 2019 and utilities in the country are set to bring 10,000MW of new grid-connected capacity online in the next two years.
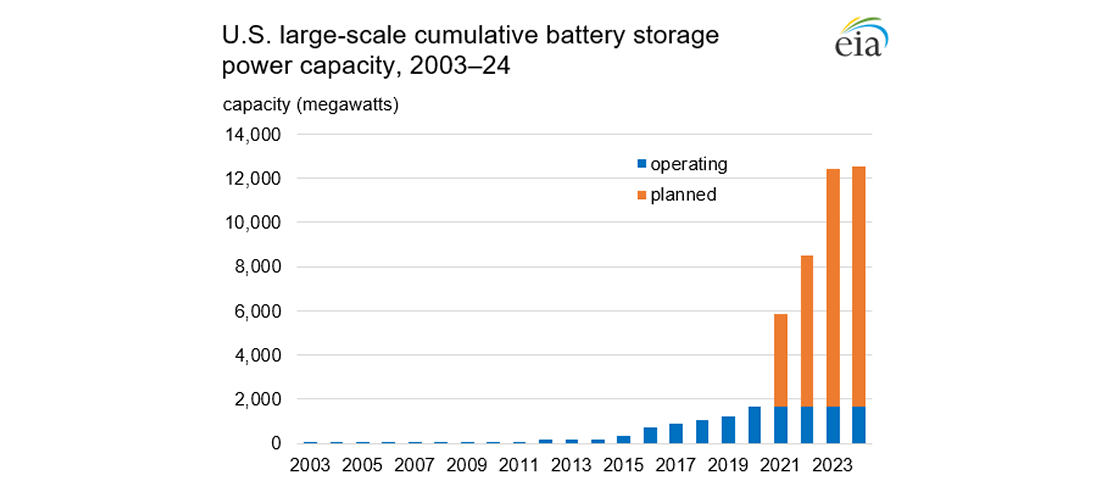
Enabling power grids to function more flexibly and resiliently, the deployment of battery storage across the US has increased from about 100MW at the end of 2012 to 1,650MW by the end of 2020, accelerating from an inflection point year in 2015. A new report from the US Department of Energy’s Energy Information Administration (EIA) takes a deep dive into the numbers.
The EIA offered a preliminary glimpse into its findings in a recent edition of its Electricity Monthly Update, which Energy-Storage.news reported at the beginning of this month. Now, the administration has issued the full Battery Storage in the United States: An Update on Market Trends, a freely available document which goes into more detail.
Planning data collected from project developers by December 2020 showed that with 10GW set to go online by 2023, the installed base would have increased more than 1,000% from 1GW of operational capacity in 2019. California leads among states, and will host about 40% of that new capacity. This is likely due to the AB2514 mandate, which ordered California investor-owned utilities (IOUs) to install 1,325MW of storage by 2024.
However, EIA noted that there are projects expected to come online in both states that have energy storage targets or requirements, like New York and Massachusetts, and states that do not, like Texas, Arizona, Nevada and others. Meanwhile a couple of states that have requirements, Virginia and New Jersey, nonetheless have no energy storage builds planned that have been reported to the administration as yet.
Solar-plus-storage represents biggest slice of new additions
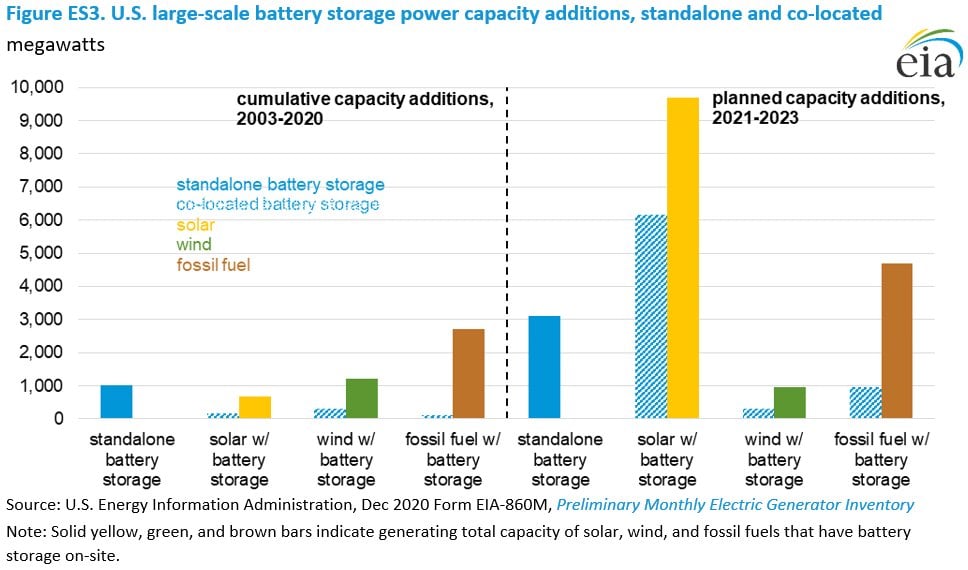
There is expected to be a significant growth in co-located solar PV and battery projects. In fact, it is set to be the most common trend that EIA has identified for deploying storage between now and 2023. Some 100 PV plants with battery storage, representing 7,689MW of capacity are planned, as opposed to 59 standalone energy storage plants representing 3,115MW.
Solar has quickly embraced batteries and while about half of operating co-located battery storage systems as of the end of 2020 were paired with wind energy, 80% of co-located plants to be built by 2023 will be solar-plus-storage. The predictable generation patterns of PV make it a technology that can be paired fairly simply with batteries that can be used to store energy at times of abundant generation and low electricity prices and then put into the grid when demand peaks and so do electricity prices.
Meanwhile, co-located batteries that charge at least 75% of the time from their solar or wind resource are eligible for tax credits, which can be considered a strong driver of the trend towards co-location, or hybrids, versus standalone battery storage. While only about 2% of existing solar PV capacity in December last year was co-located with batteries, about 25% of planned PV plants will be.

Standalone battery storage no longer represents the biggest segment. Image: US Energy Information Administration.
The national Energy Storage Association (ESA) trade group has long championed the introduction of a standalone battery storage investment tax credit (ITC) to help spur further deployment. According to studies from the Lawrence Berkeley National Laboratory, there are some instances where pairing with onsite renewables can offer less value than siting separately.
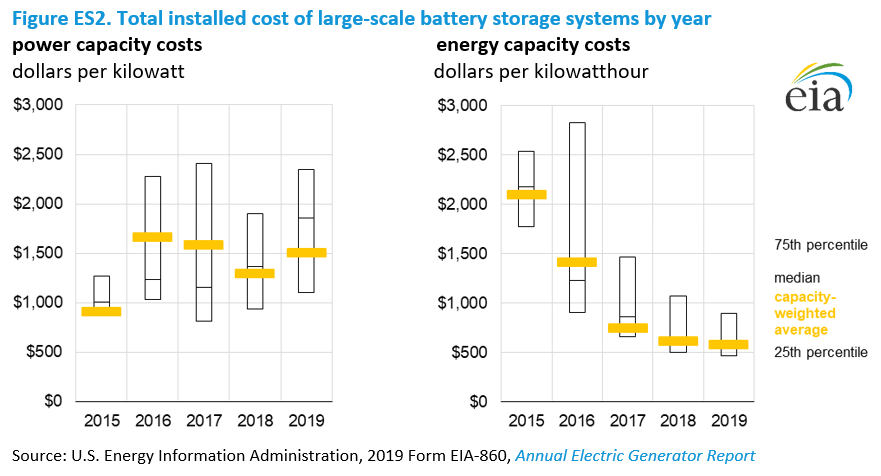
Large-scale battery storage capacity cost fell from US$2,102 per kWh in 2015 to US$589 per kWh in 2019, while power capacity costs remained relatively stable in the range of between US$913 per kW and US$1,664 per kW on average during that time. Projects of increasing duration and larger energy capacities have been announced in the past few years. While some specific markets such as local Resource Adequacy in the California Public Utilities Commission’s jurisdiction require four-hour battery duration, the average duration for large-scale projects across the US in 2019 was 2.3 hours.
About 402MW of small-scale battery storage has been deployed as of the end of 2019, with California accounting for 83% of that figure. After California, Hawaii, Vermont and Texas are among the leaders in that segment. This segment could be set for growth after early 2022, when FERC Order 2222, through which the federal regulator ordered regional transmission organisations (RTOs) and independent system operators (ISOs) to allow small-scale systems close to load to participate in market opportunities previously open only to large-scale.

Large-scale battery costs plummeted in energy capacity terms, while remaining largely stable in power capacity terms. Image: US Energy Information Administration.
235GWh by 2050
Only 50MW of large-scale battery power capacity went online between 2003 — the date the first system was reported to EIA as in service — and 2010, but the next nine years saw 972MW go online and 2020 (which saw a 458MW increase according to preliminary data) broke 2018’s record (222MW). Independent power producers (IPPs) have so far deployed the most battery storage, but investor-owned utilities (IOUs) in California have also procured “significant amounts of capacity,” EIA said.
By 2050, according to the Annual Energy Outlook document that the EIA published in February, the US is forecast in a reference case to have 59GW / 235GWh of large-scale battery storage online, including 21GW / 82GWh of standalone storage and 38GW / 153GWh of storage paired with PV.
The EIA’s report also looks at a number of other market statistics and dynamics, including policy drivers and utility planning requirements at state level that are supporting energy storage growth. It also offers a brief look at battery technologies, finding that more than 90% of large-scale battery storage as of the end of 2019 is lithium-ion with a scattering of nickel-based batteries, sodium-based batteries comprising 2% of installed power capacity and 4% of energy capacity. Lead acid accounted for less than 1% of power capacity and flow batteries for about 1% of power and energy.
You can view the full ‘Battery Storage in the United States: An Update on Market Trends’ report, at the US Energy Information Administration website here.
Source: www.energy-storage.news
 Cs
Cs